๐Ÿ  Home

Week 3

Models for Software Architecture

BS Software Engineering - IV - A

Instructor: Baber Sheikh (Visiting Faculty)

3.1. UML for Software Architecture

  • 3.1.1. Structural Diagrams
  • 3.1.2. Behavioral Diagrams

3.2. Architecture View Models

  • 3.2.1. The Scenario View
  • 3.2.2. The Logical or Conceptual View
  • 3.2.3. The Development or Module View
  • 3.2.4. The Process View
  • 3.2.5. The Physical View
  • 3.2.6. The User Interface View
  • 3.2.7. Architecture Description Languages (ADL)

Chapter 3: Models for Software Architecture

๐Ÿ”„ Week 2 Recap: The Design Space

๐ŸŽฏ Design Space = Elements + Connectors

Software architecture is defined by the elements (what code/runtime units exist) and the connectors (how they interact).

๐Ÿ‘จโ€๐Ÿ’ป Architect's Role

Must understand the full "menu" of options (Design Space) to choose the right tools for the job.

๐Ÿงฉ Key Challenge

Balancing functional requirements (what it does) with non-functional requirements (speed, security, cost).

๐Ÿ”„ Week 2 Recap: Three Perspectives

Architecture can be understood through three key perspectives, each addressing different concerns of the system.

1. Static Structure

(Code / Development View)

The physical files, directories, and compile-time dependencies.

Ex: Classes, Packages

2. Runtime Structure

(Execution / Process View)

The running threads, processes, and active objects in memory.

Ex: Threads, Objects

3. Management Structure

(Allocation / Organization View)

How development responsibilities are distributed across teams.

Ex: UI Team, backend Team

โš ๏ธ Critical Clarification:

Some connectors (e.g., function calls) exist in both views:
๐Ÿ‘‰ Static view: How calls are defined in code.
๐Ÿ‘‰ Runtime view: How calls actually execute in memory.

๐Ÿ“Š Comparison: The Crux of Week 2

Refined definitions for exam preparation.

Perspective Definition & Elements Connectors Key Properties
Static
(Code / Development)

Describes compile-time organization.

  • Source files
  • Classes
  • Packages / Modules
  • Imports / Includes
  • Inheritance
  • Interface implementation
  • Modularity
  • Maintainability
  • Reusability
Runtime
(Execution / Process)

Describes system as it executes.

  • Processes & Threads
  • Runtime objects
  • Services
  • IPC / RPC
  • Network communication
  • Shared memory
  • Performance
  • Scalability
  • Availability & Security
Management
(Allocation / Organization)

Describes distribution of responsibilities.

  • Development teams
  • Roles (UI, Backend, QA)
  • Stakeholders
  • Meetings
  • Documentation
  • Communication channels
  • Cost
  • Time-to-market
  • Team efficiency

๐Ÿ’ก Key Insight: The Complete Picture

"Each architectural view highlights different system qualities."

No single view is sufficientโ€”multiple views together form a complete architectural description.

(This is the main takeaway for the exam!)

๐Ÿ—๏ธ Software Architecture Fundamentals

๐Ÿ“š Key Definition:

Software architecture specifies a high level of abstraction by employing:

  • Decomposition - Breaking down the system
  • Composition - Putting it back together
  • Architecture Styles - Patterns of organization
  • Quality Attributes - Non-functional requirements

๐Ÿงฉ Must Describe:

  • Collection of Components
  • Connections & Interactions
  • Deployment Configuration

โœ… Must Conform To:

  • Functional Requirements (What it does)
  • Non-functional Requirements (How well it does it)

๐Ÿ“ฆ Box-and-Line Diagrams

๐Ÿ–Š๏ธ Usage:

  • Used in Analysis Phase
  • Describes Business Concepts & Processes
  • Intuitive interpretation (Specification purposes)

๐Ÿ“ Lines Meaning:

Unlike UML, semantics vary! Lines can mean:
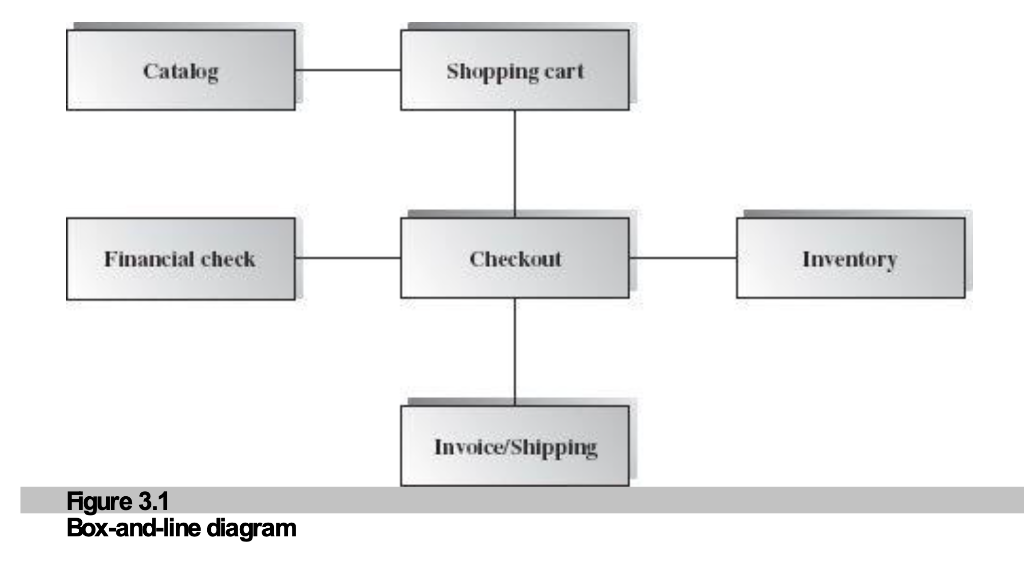
  • Dependency
  • Control Flow / Data Flow
  • Arrows = Process direction/sequence
Figure 3.1: Box-and-line diagram example

Figure 3.1: Online Shopping Example

view 4+1 View Model

A blueprint for functional & non-functional requirements.

1. Logical View

Identifies modules, boundaries, interfaces, usage scenarios.

2. Process View

Runtime performance, module communication styles.

3. Development View

Organization of software units (files, directories).

4. Physical View

Deployment infrastructure (hardware, network, installation).

5. User Interface View

Wait, is this standard? (Authors added this). Look & Feel.

โญ Scenarios View

Validates ALL other views! Based on use cases.

3.1 UML for Software Architecture

๐Ÿ“š What is UML?

Unified Modeling Language (UML) is a graphical language for visualizing, specifying, constructing, and documenting the artifacts of a software-intensive system.

It offers a standard way to draw a system's blueprints.

๐ŸŽฏ Usage:

  • Model the Problem Domain.
  • Describe User Requirements.
  • Identify Architecture Elements (Classes, Objects).
  • Organize Software Structure.

๐Ÿ—๏ธ Scope:

  • Conceptual: Business processes, functions.
  • Concrete: Code statements, DB schemas, Components.
  • Code Gen: Can even generate code skeletons!

๐Ÿ—‚๏ธ UML Categories & Tools

UML diagrams are grouped into two major categories:

1. Structural (Static)

Describes the static structure of elements.

  • Class hierarchy, Libraries
  • Relationships (Is-a, Has-a, Uses-a)
  • Time-independent

2. Behavioral (Dynamic)

Describes the behavior of objects.

  • Object collaboration & interaction
  • Activity & Concurrency
  • Change over time

๐Ÿ› ๏ธ Popular UML Tools

Many can map diagrams directly to code (C++, Java, C#)!

Rational Rose Borland Together Microsoft Visio StarUML

๐Ÿ—๏ธ 3.1.1 Structural (Static) Diagrams

Diagram Description
Class Overview of classes and their static relationships. Does not show dynamic interaction.
Object Snapshot of instances at a specific point in time. Based on Class diagram.
Composite Structure Inner structure of a component, including internal classes and interfaces.
Component Outline of composition structure of modules, their relationships, and interactions.
Package Structure and organization of packages and classes within them.
Deployment Hardware, software, and network connections in a real-world distributed setting.

๐ŸŽฌ 3.1.2 Behavioral (Dynamic) Diagrams

Diagram Description
Use Case Overview of actors and use cases. Captures system requirements from external user perspective.
Activity Data and control flow among objects. Decision points and threads of complex processes.
State Machine Life cycle of objects (States + Transitions). Transitions caused by events/stimuli.
Sequence Time sequence of messages passed among objects (Timeline focus).
Communication Sequence of message passing focusing on Object Roles (Network focus).
Interaction Combines Activity and Sequence diagrams for control flow overview.
Timing Changes in state/condition/events over time.

๐Ÿ—๏ธ 3.2.1.1 Class Diagram

๐Ÿ“š The Foundation of System Design

The Class Diagram provides a static view of the system and captures its vocabulary.

It is the most frequently used UML diagram, refined iteratively throughout the SDLC.

๐Ÿงฉ Class Elements

  • Type: Name of the class.
  • Interface: Behavioral contracts (What it must do).
  • Properties: Attributes/Fields.
  • Methods: Operations/Functions.
Visibility: +public, -private, #protected

๐Ÿ”— Relationships & Multiplicity

  • Inheritance: Is-a (Triangle arrow โ–ต)
  • Aggregation: Has-a (Diamond โ—‡)
  • Association: Uses-a (Line โ€”)
Counts: 1 (One), 0..1 (Zero/One), 1..* (At least one)

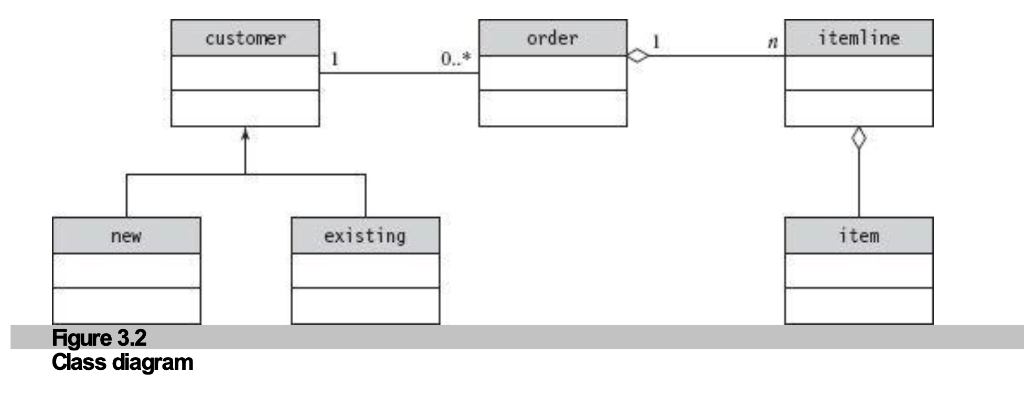
๐Ÿ–ผ๏ธ Class Diagram Example: Order Processing

Figure 3.2: Class Diagram Example

Figure 3.2: Online Purchase Order System

๐Ÿ“Š Analysis of Figure 3.2

  • Customer (Base): Parent of New and Existing (Inheritance โ–ต).
  • Order Relationship: A Customer places 0..* Orders (Association).
  • Order Structure: Order contains ItemLine (Aggregation โ—‡).
  • ItemLine: Linked to specific Items.

Note: Typical Logical Structure of a purchase system showing 6 interacting classes.
๐Ÿงฉ 3.2.1.2 Object Diagram

๐Ÿ“ท A Snapshot in Time

Attributes are "static", but Objects are alive. An Object Diagram shows a snapshot of instances at a specific runtime moment.

It is a concrete example of the Class Diagram.

๐Ÿ” Purpose

  • Describe a sample subset of system objects.
  • Show actual connections & interactions.
  • Validate the Class Diagram design.

๐Ÿค Related Diagrams

Object diagrams are often referenced by:

  • Sequence Diagrams (time-ordered messages)
  • Communication Diagrams (role-based messages)
  • Interaction Diagrams

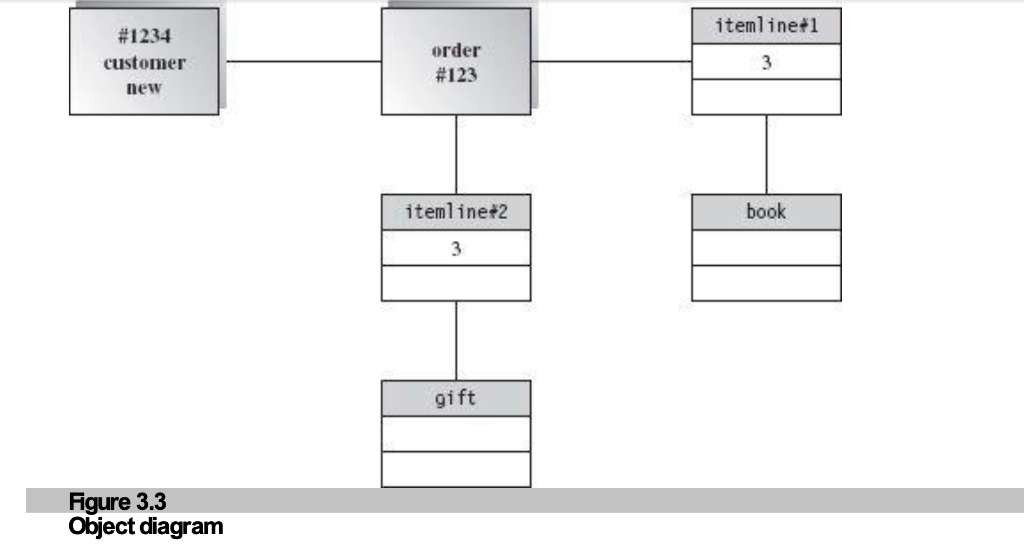
๐Ÿ–ผ๏ธ Object Diagram Example: Runtime Order

Figure 3.3: Object Diagram Example

Figure 3.3: Instances of Figure 3.2

๐Ÿ“Š Analysis of Figure 3.3

This shows one specific scenario:

๐Ÿ‘ค Customer: #1234 (A "new" customer)
๐Ÿ“ฆ Order: #123
๐Ÿ›’ Items: Has ordered 2 items:

  • ItemLine #1: 3 units of "Book"
  • ItemLine #2: 3 units of "Gift"

*Notice how distinct objects (instances) replace the generic classes.
๐Ÿงฑ 3.2.1.3 Composite Structure Diagram

๐Ÿค Composition & Collaboration

Describes the internal structure of a class or conversation between instances.

It focuses on how interconnected elements collaborate at runtime.

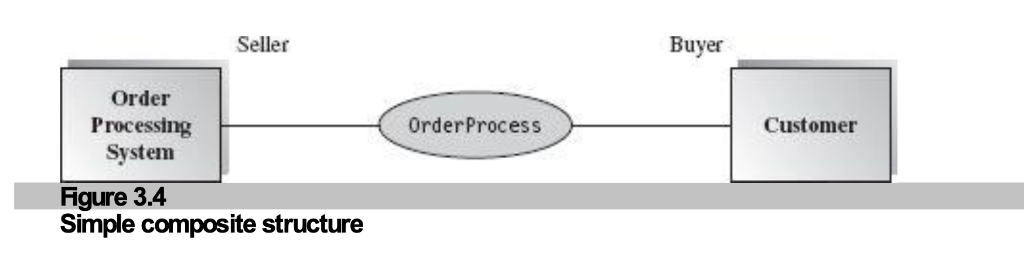
๐Ÿ–Š๏ธ Basic Notations

Collaboration: Dashed Ellipse
Structured Class: Rectangular Box

๐ŸŽญ Roles

Each class in the structure typically has an Annotation indicating its Role.

(e.g., "Buyer", "Seller")

๐Ÿ–ผ๏ธ Composite Structure Example: OrderProcess

Figure 3.4: Composite Structure Example

Figure 3.4: Simple Composite Structure

๐Ÿ“Š Analysis of Figure 3.4

The "OrderProcess" Collaboration

Notice: OrderProcess (the dashed oval) is NEITHER a class NOR an object.

It represents the collaboration itself.

  • Seller Role: Played by Order Processing System.
  • Buyer Role: Played by Customer.

๐Ÿงฉ 3.2.1.4 Component Diagram

๐Ÿงฑ Reusable Building Blocks

A Component is a deployable, reusable unit (e.g., .jar, .dll, .ear).

It hides implementation and exposes services via Interfaces.

๐Ÿ”‘ The Contract (Interface)

The interface acts as a contract between the component and its clients.

๐Ÿญ UML 2.0 Notations

  • Provided Interface: Lollipop shape ๐Ÿญ
    (I implement this)
  • Required Interface: Cup shape ๐Ÿต
    (I need this from others)

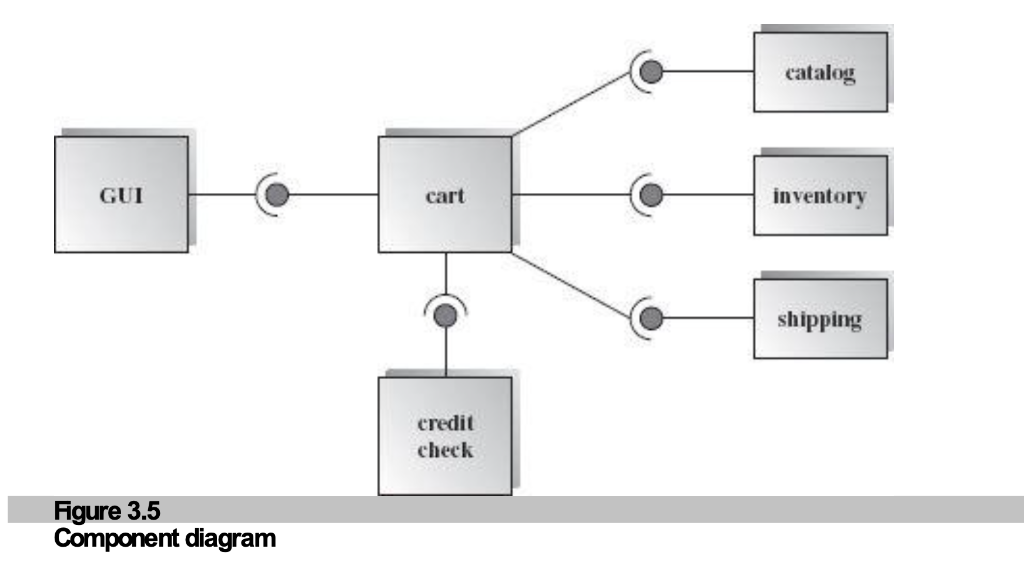
๐Ÿ–ผ๏ธ Example 1: Shopping Cart

Figure 3.5: Component Diagram - Shopping Cart

Figure 3.5: Shopping Cart Components

๐Ÿ“Š Analysis of Figure 3.5

Central Component: Cart
  • Provides: Services to the GUI (ASP/JSP/PHP).
  • Requires Services from:
    • ๐Ÿ“ฆ Inventory
    • ๐Ÿ“– Catalog
    • ๐Ÿšš Shipping
    • ๐Ÿ’ณ Credit Check

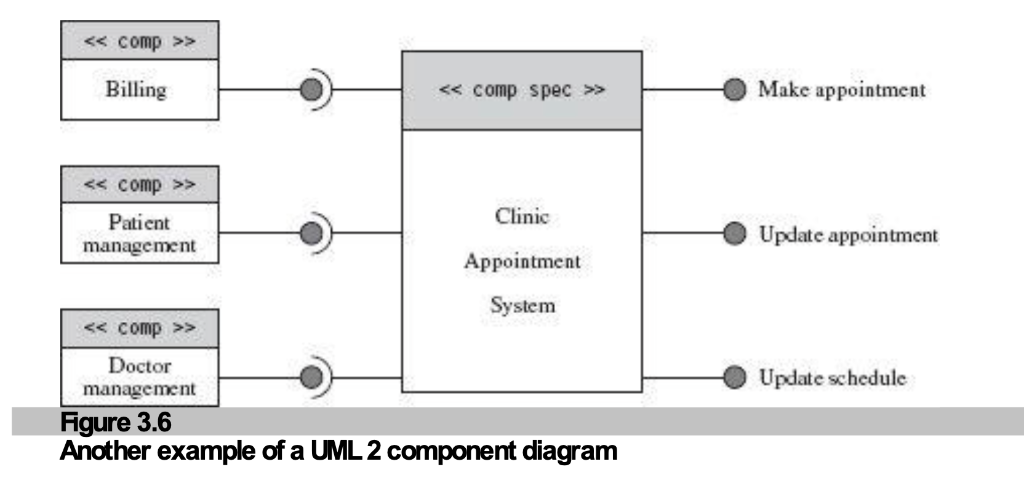
๐Ÿ–ผ๏ธ Example 2: Clinic System

Figure 3.6: Component Diagram - Clinic

Figure 3.6: Clinic Management Components

๐Ÿ“Š Analysis of Figure 3.6

Central: Clinic Appointment System
  • Provides 3 Services:
    (Make Appt, Update Appt, Update Schedule)
  • Requires 3 Backends:
    • ๐Ÿงพ Billing
    • ๐Ÿฅ Patient Management
    • ๐Ÿ‘จโ€โš•๏ธ Doctor Management

๐Ÿ“ฆ 3.2.1.5 Package Diagram

๐Ÿ“‚ Organizing the Chaos

A Package is a "tabbed folder" that groups functions and sub-packages.

Think of them like directories in a file system or namespaces in Java/.NET.

๐ŸŽฏ Purpose

  • Organization: Groups related classes.
  • Access Control: Defines visibility boundaries.
  • Namespace Sharing: Allows unique naming within packages.

๐Ÿ”— Dependency Handling

Package diagrams show how a change in one package might ripple to others.

Benefit: Reduces dependency complexity!

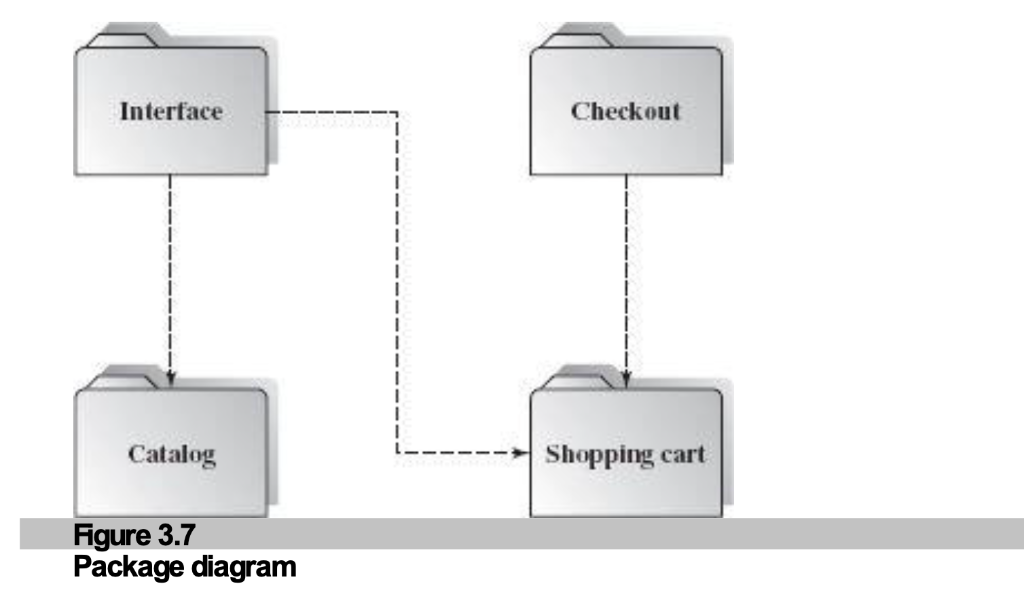
๐Ÿ–ผ๏ธ Package Diagram Example

Figure 3.7: Package Diagram Example

Figure 3.7: Component-Based Architecture Design

๐Ÿ“Š Analysis of Figure 3.7

Shows dependencies (dashed arrows) between 4 packages:

1. Interface โž” Catalog & Shopping Cart

GUI depends on logic & data.

2. Checkout โž” Shopping Cart

Checkout needs cart contents.

* "Interface" contains all GUI classes.
* "Checkout" contains checkout logic classes.
๐Ÿ“ก 3.2.1.6 Deployment Diagram

๐Ÿ’ป Physical Configuration

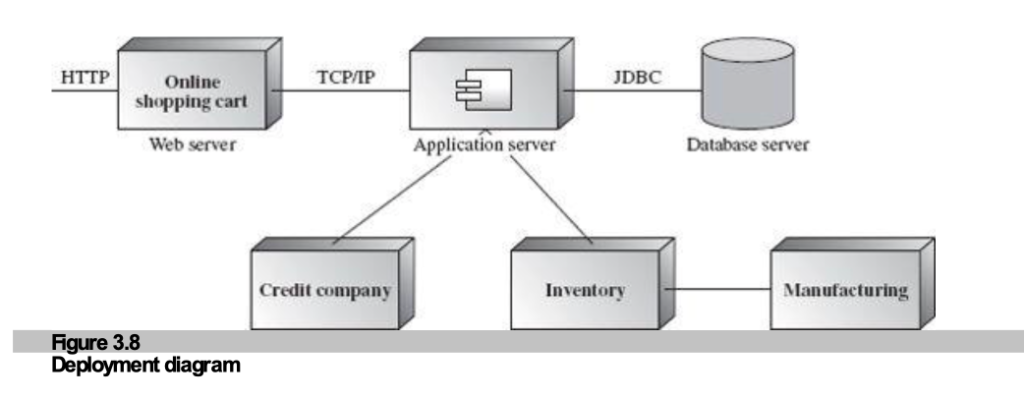
Depicts the hardware nodes and the network connections between them.

It maps software components to hardware devices.

๐Ÿ“ฆ Nodes & Artifacts

  • Node (Cube): A hardware resource (Server, Device) or execution environment.
  • Artifact: Software component deployed on a node.

๐ŸŒ Protocols

Links between nodes represent network connections defined by Protocols.

HTTP, TCP/IP, JDBC, RMI

๐Ÿ–ผ๏ธ Deployment Diagram Example

Figure 3.8: Deployment Diagram Example

Figure 3.8: Distributed System Deployment

๐Ÿ“Š Analysis of Figure 3.8

A classic 3-Tier Architecture deployment:

  • Web Server Node: Hosts Online Shopping Cart.
    โžœ Connects via HTTP to Client.
  • App Server Node: Hosts Business Logic.
    โžœ Connects via TCP/IP to Web Server.
  • Database Server Node: Hosts Data.
    โžœ Connects via JDBC to App Server.
External Services: Credit Co, Inventory, Mfg (also Nodes).

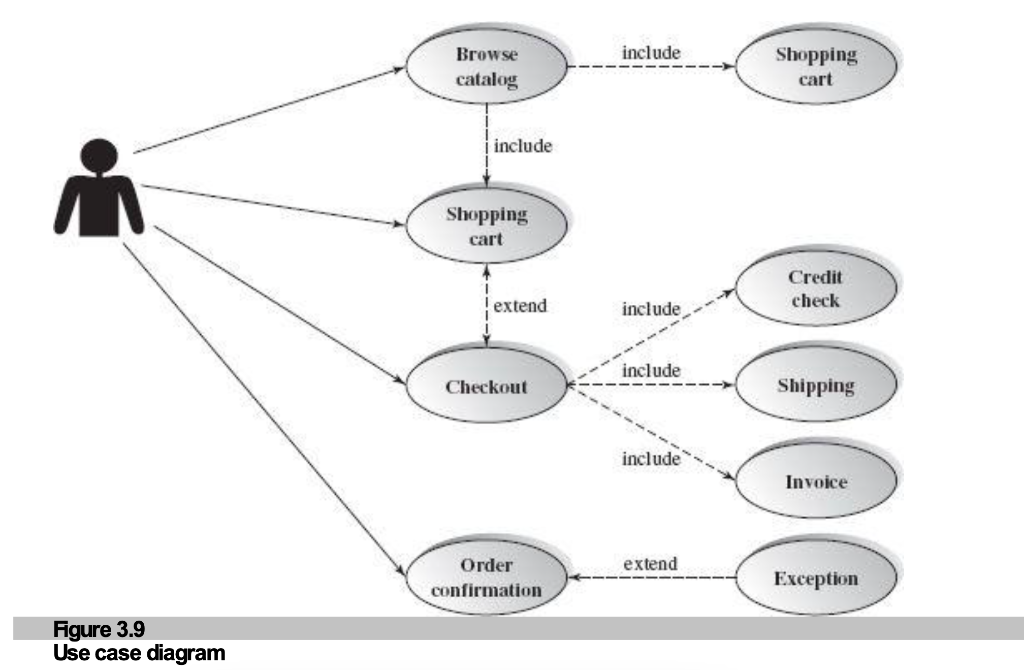
๐Ÿ‘ค 3.2.2.1 Use Case Diagram

๐ŸŽฌ The User's Perspective

Describes system functionality as a contract between Actors (Users) and the System.

Actor: External user, app, or system. Use Case: Meaningful work scenario.

๐Ÿ”— Connection Types

association: Simple line. actor uses the use case.
<<include>> (Mandatory)
Use Case A always uses B. (Reuse)
<<extend>> (Optional)
Use Case A employs B under certain conditions.

๐ŸŽฏ Purpose

  • Capture User Requirements.
  • Operational work scenarios.
  • Pre-conditions & Post-conditions.
  • Foundation for structural & other behavioral diagrams.

๐Ÿ–ผ๏ธ Use Case Diagram Example

Figure 3.9: Use Case Diagram Example

Figure 3.9: Shopping Cart Scenarios

๐Ÿ“Š Analysis of Figure 3.9

  • Actor: Customer (Human user).
  • Include Relationship (Mandatory):
    Checkout --<<include>>--> Credit Check, Shipping, Invoice.
  • Extend Relationship (Optional):
    Exception --<<extend>>--> Order Confirmation.
โšก 3.2.2.2 Activity Diagram

๐Ÿ”„ Modeling Process Workflow

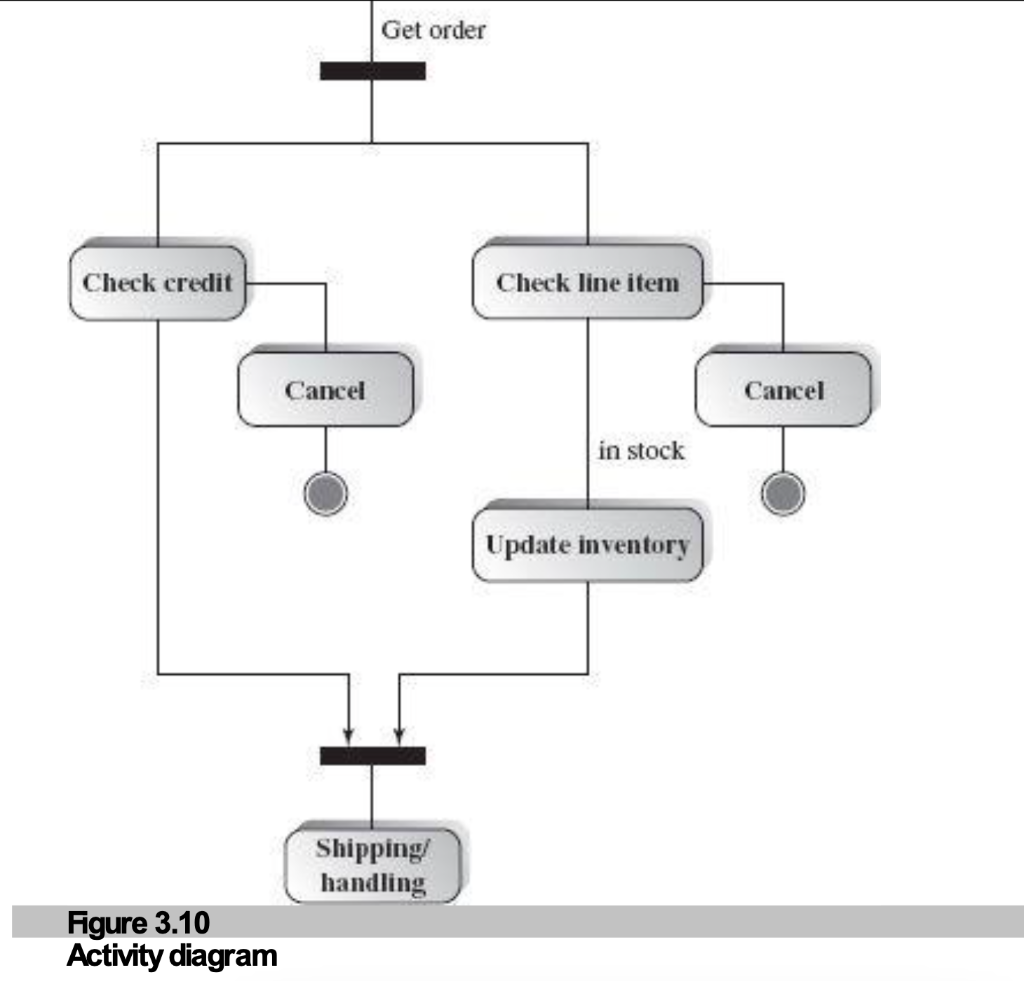
Describes complex business processes, including concurrent execution and decisions.

It corresponds to a single business process (workflow-oriented).

๐Ÿ–Š๏ธ Key Notations

  • Activity: Rounded Rectangle.
  • Decision: Small diamond ๐Ÿ”น.
  • Start/End: Filled circle (Start) / Bullseye (End).

๐Ÿ”€ Concurrency (Fork & Join)

Black Horizontal Bars indicate:

  • Fork: Split into parallel paths.
  • Join: Wait for all paths to complete.

๐Ÿ–ผ๏ธ Activity Diagram Example

Figure 3.10: Activity Diagram Example

Figure 3.10: Purchase Order Processing

๐Ÿ“Š Analysis of Figure 3.10

Demonstrates Parallel Processing:

1. Start โž” Fork

Gets Order, then splits execution.

2. Parallel Activities
  • Check Credit (can Cancel)
  • Check Line Item โž” Update Inventory (can Cancel)
3. Join โž” End

Both valid? โžœ Shipping/Handling.

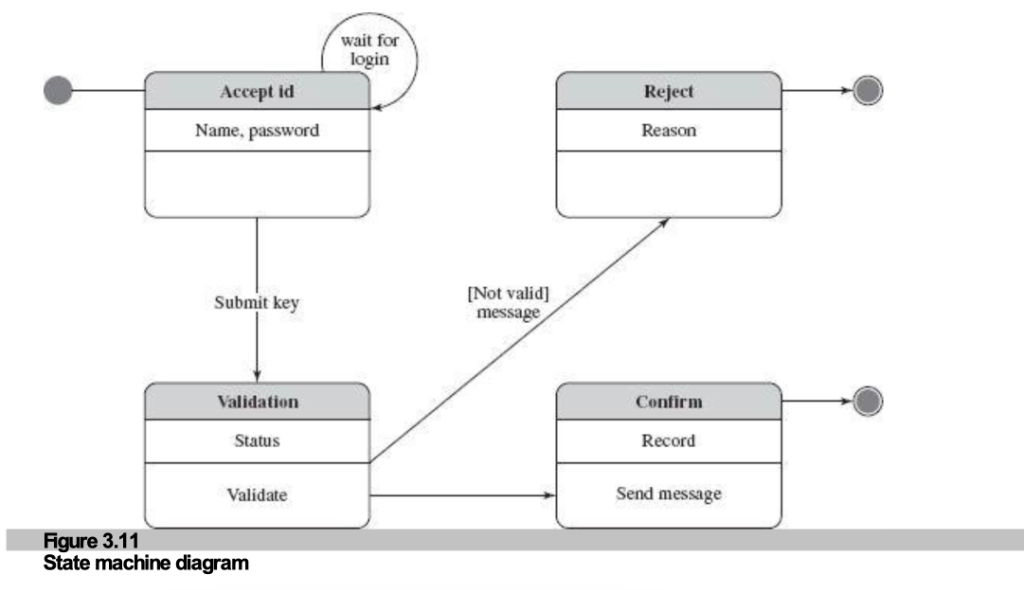
3.2.2.3 State Machine Diagram

๐Ÿ”น Key Concepts

  • Event-Oriented: System elements change state in response to external/internal stimuli (events).
  • Usage: widely used for embedded systems and device software analysis/design.
  • Purpose: Specifies the internal behavior of objects (conditions, actions, waiting).

๐Ÿ”น Notation & Syntax

  • State: Rounded rectangle with 3 subdivisions (Name, Variables, Activities).
  • Start Point: Solid black circle โšซ.
  • End Point: Eye-circle (Bullseye) โฆฟ.
  • Transitions: Solid lines with arrowheads โž.
  • Sub-states: Complex states can have sequential or concurrent sub-states.

๐Ÿ–ผ๏ธ State Machine Diagram Example

Figure 3.11: State Machine Diagram

Figure 3.11: Login Process

๐Ÿ“Š Analysis of Figure 3.11

Depicts a standard Login Verification flow:

1. Wait & Accept

Initial loop waiting for User ID/Password input.

2. Validation State

System verifies credentials against records.
3. Outcome (Final States)
  • Match: Confirm login โž Record โž Msg โž End.
  • No Match: Reject login โž Reason โž End.

3.2.2.4 Interaction Overview Diagram

๐Ÿ”น Key Concepts

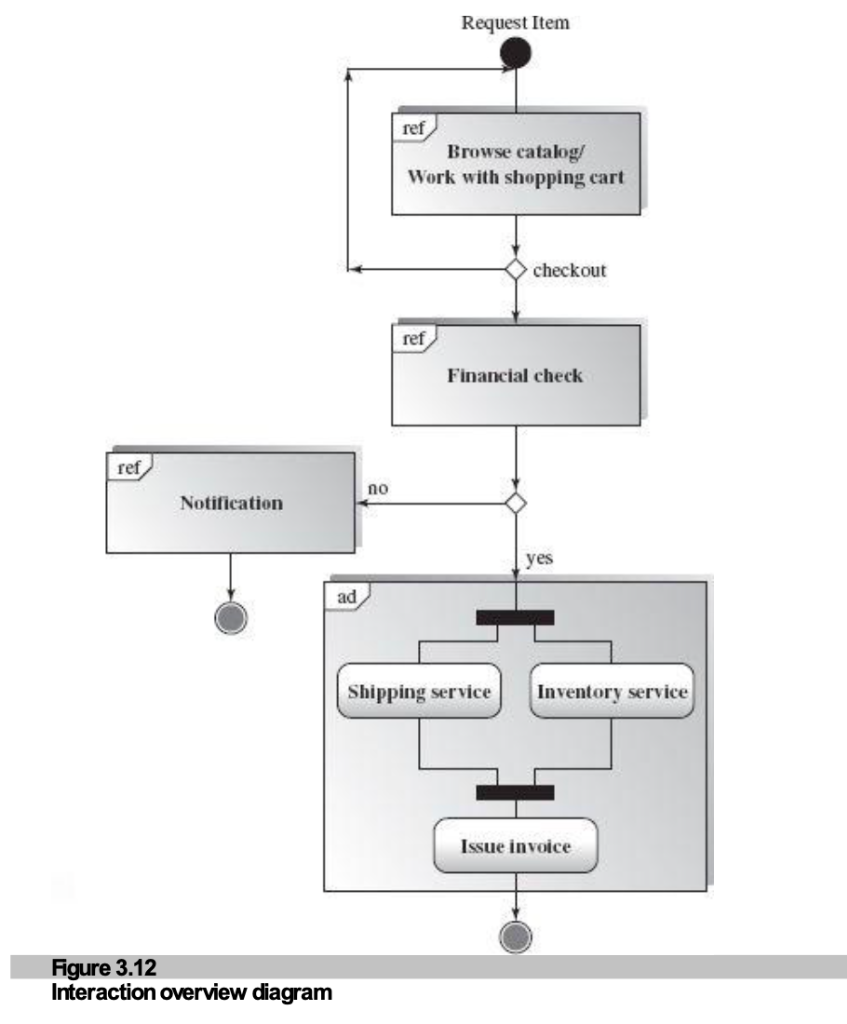
  • Overview: Describes the control flow of interactions rather than just messages.
  • Relationship: A variant of the Activity Diagram.
  • Abstraction: Provides a high-level view of interaction sequences.

๐Ÿ”น Nodes & Notation

  • Frames: Each node represents an interaction or diagram.
  • ref (Reference): Points to an existing diagram (indicated by "ref" in top-left).
  • Basic Element: Displays an inline diagram (labelled `ad` for Activity, `sd` for Sequence, `cd` for Communication).

๐Ÿ–ผ๏ธ Interaction Overview Diagram Example

Figure 3.12: Interaction Overview Diagram

Figure 3.12: Item Request Flow

๐Ÿ“Š Analysis of Figure 3.12

Shows a high-level Order Processing flow referencing other diagrams:

1. References (ref)
  • Browse Catalog: External interaction.
  • Financial Check: External validation process.
  • Notification: External alert system.
2. Inline Activity (ad)

Contains Shipping and Inventory services running in parallel, merging to Issue invoice.

3. Control Flow

Request Item โž Browse โž Checkout? โž Financial Check โž Valid? โž Processing (ad) or Notification.

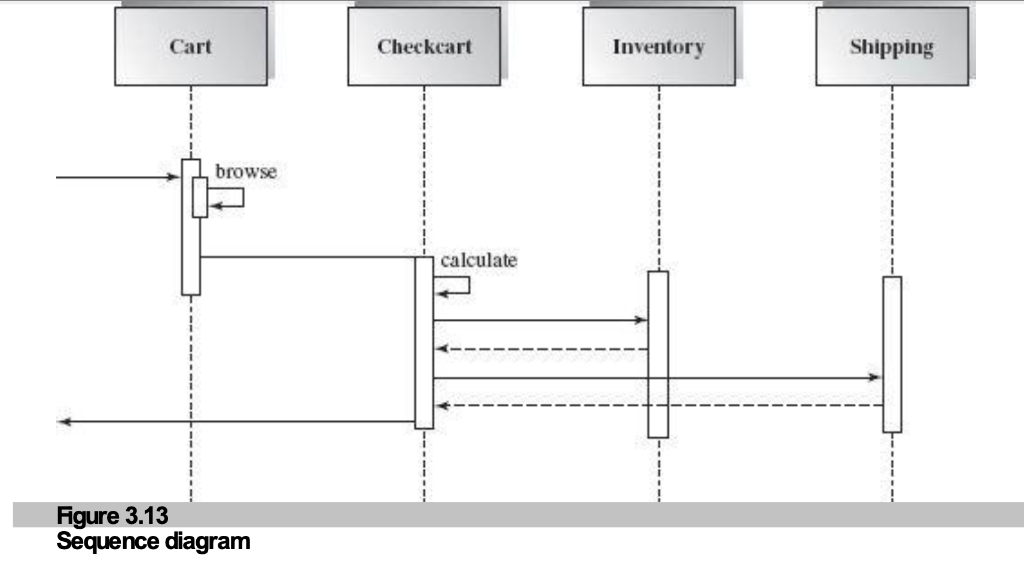
3.2.2.5 Sequence Diagram

๐Ÿ”น Key Concepts

  • Time-Oriented: Shows the chronological sequence of messages between objects.
  • Usage: widely used; typically one diagram per Use Case.
  • Structure:
    • Lifeline: Vertical timeline for each object.
    • Activation: Narrow rectangle showing active processing.

๐Ÿ”น Message Types

  • Synchronous: Solid line, full arrowhead โž (Sender waits).
  • Asynchronous: Line with half arrowhead โ‡€ (Sender continues).
  • Reply/Return: Dotted arrow โ‡ข.
  • Self-Message: Recursive loop (internal processing).

๐Ÿ–ผ๏ธ Sequence Diagram Example

Figure 3.13: Sequence Diagram

Figure 3.13: Online Shopping

๐Ÿ“Š Analysis of Figure 3.13

Illustrates the Checkout process timeline:

1. Cart โž Checkcart

User browses, then triggers checkout. Checkcart calculates total (self-message).

2. Inventory Check (Synchronous)

Checkcart requests stock. Must wait for dashed-line reply before proceeding.

3. Shipping โž Completion

Initiates shipping, then returns final confirmation to User.
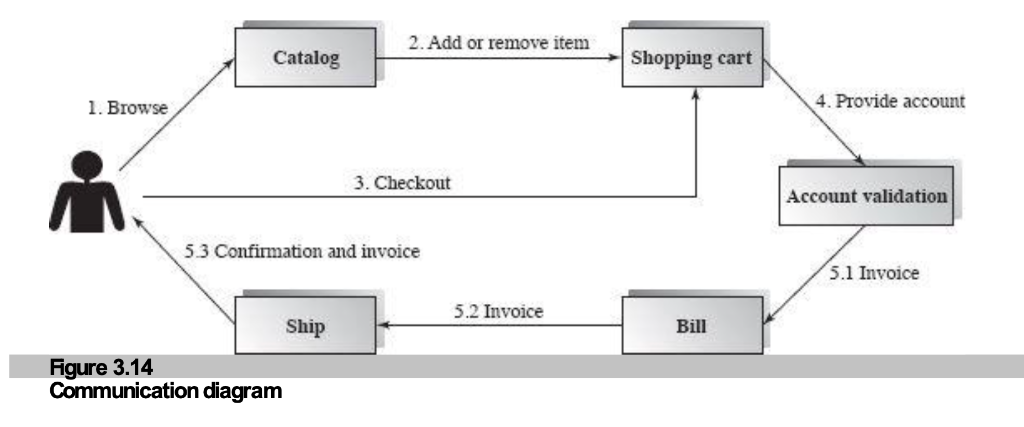
3.2.2.6 Communication Diagram

๐Ÿ”น Key Concepts

  • Also Known As: Collaboration Diagram (UML 1.x).
  • Message-Oriented: Focuses on object coordination and control flow.
  • Relationship: Extension of the Object Diagram (links = associations).

๐Ÿ”น Notation & Equivalence

  • Structure: Objects connected by links.
  • Messages: Arrows above links with sequence numbers (e.g., 1. Browse, 2. Add).
  • Equivalence: Semantically equivalent to Sequence Diagrams.
  • Focus: Space/Layout (Communication) vs. Time (Sequence).

๐Ÿ–ผ๏ธ Communication Diagram Example

Figure 3.14: Communication Diagram

Figure 3.14: Shopping Process (Collaboration)

๐Ÿ“Š Analysis of Figure 3.14

Shows the same Checkout process as Figure 3.13 but emphasizing links:

Step-by-Step Flow
  • 1. Browse: User โž Catalog
  • 2. Add/Remove: Catalog โž Shopping Cart
  • 3. Checkout: User โž Shopping Cart
Validation & Billing
  • 4. Provide Account: Cart โž Account Validation
  • 5.1 Invoice: Validation โž Bill
  • 5.2 Invoice: Bill โž Ship
Final Confirmation

5.3 Confirmation: Ship โž User (Closing the loop).

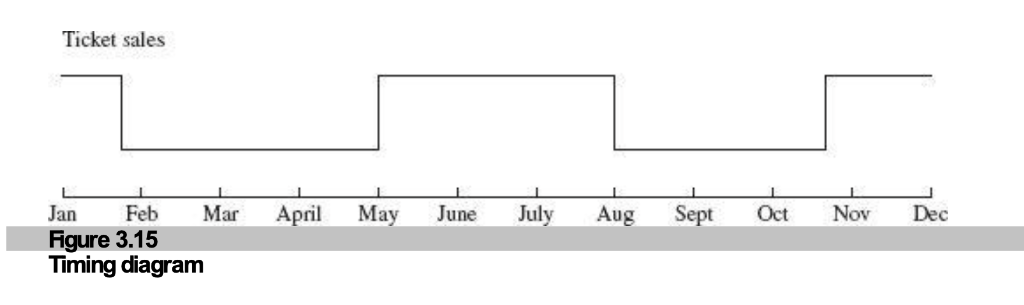
3.2.2.7 Timing Diagram

๐Ÿ”น Key Concepts

  • New in UML 2.0: Combines State and Time sequences.
  • Focus: Shows dynamic state changes caused by external events over time.
  • Visual: Waveforms or stepped lines representing state transitions.

๐Ÿ”น Usage Constraints

  • Domain: Time-critical systems.
  • Examples: Real-time operating systems (RTOS), Embedded systems.
  • Purpose: to analyze precise timing constraints and state durations.

๐Ÿ–ผ๏ธ Timing Diagram Example

Figure 3.15: Timing Diagram

Figure 3.15: Air Ticket Pricing

๐Ÿ“Š Analysis of Figure 3.15

Illustrates Seasonal Discount Pricing over a calendar year:

1. State: High Price (Base)

Jan, May-July, Nov-Dec: Ticket sales are at peak price (High state).

2. State: Low Price (Discount)

Feb-Apr, Aug-Oct: Price drops to discount level (Low state).

3. Transitions

Vertical lines indicate instantaneous state changes triggered by date events.
3.3 Architecture View Models

๐Ÿ”น Definition & Purpose

  • Model: A simplified description of a system from a particular perspective.
  • Reality: No single view can capture all aspects of complex software.
  • Goal: Provide partial representations relevant to specific stakeholders.

๐Ÿ”น Stakeholders

  • Users: Focus on functionality (Scenario View).
  • Developers: Focus on code structure (Development View).
  • Integrators: Focus on component assembly.
  • Systems Engineers: Focus on hardware mapping (Physical View).

3.3.1 The Scenario View

๐Ÿ”น Key Concepts

  • Functionality: Describes how the user employs the system to receive services.
  • Foundation: Acts as the "glue" for the other 4 views (Logic, Process, Dev, Physical).
  • Validation: Ensures the architecture meets functional/non-functional requirements.

๐Ÿ”น Artifacts & Usage

  • Primary Artifact: UML Use Case Diagram (e.g., Figure 3.9).
  • Role: Drivers architecture design in early phases; used for validation in later phases.

๐Ÿ–ผ๏ธ The Extended 4+1 View Model

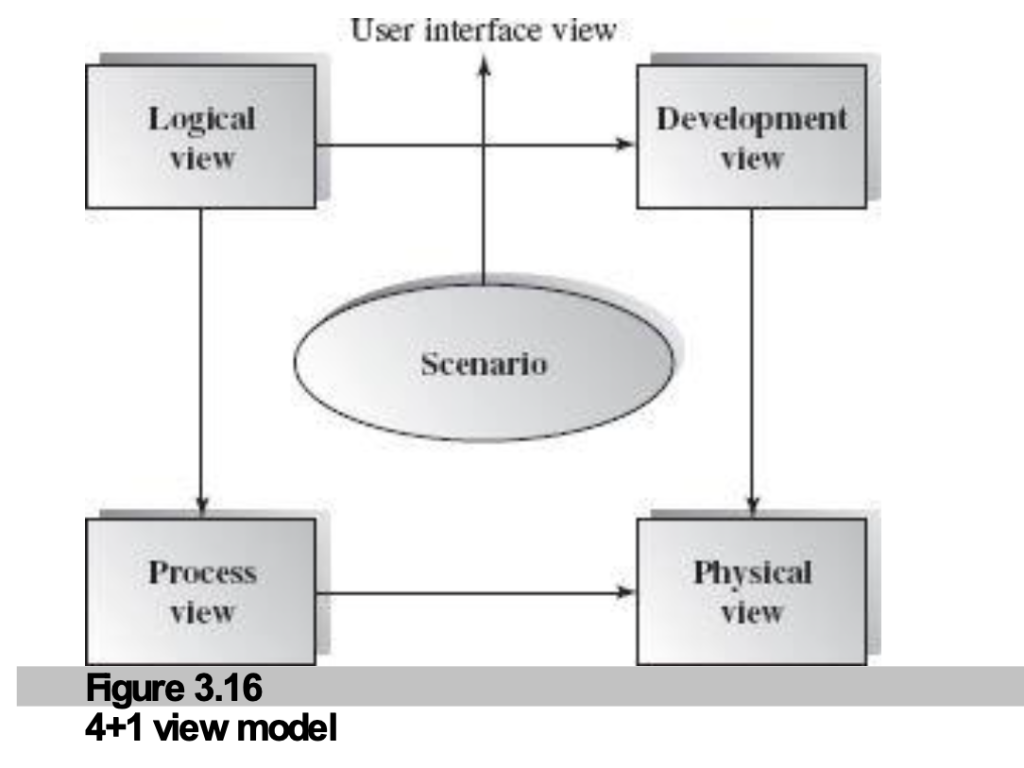
Figure 3.16: Extended 4+1 View Model

Figure 3.16: 4+1 View Model + UI View

๐Ÿ“Š Understanding Figure 3.16

Philippe Kruchten's model (1995) extended with a UI View:

Center: Scenario View

The central "oval" that connects and validates all other views.

The 4 Views
  • Logical: Objects & Interactions.
  • Process: Concurrency & Sync.
  • Development: Static structure.
  • Physical: Hardware mapping.
New: User Interface View

Verifies usability requirements; complies with Scenario view.
3.3.2 The Logical (Conceptual) View

๐Ÿ”น Definition

  • Base: Application domain entities implementing functional requirements.
  • Focus: Main building blocks and key abstractions (e.g., Objects).
  • Nature: An abstraction of the system's requirements.

๐Ÿ”น Characteristics

  • Methodology: Typically used for Object-Oriented (OO) modeling.
  • Decomposition: Splits system into conceptual entities and associations.
  • Purpose: Understand interactions in the problem space.

Logical View: Support & Audience

๐Ÿ”น Supported UML Diagrams

  • Static:
    • Class Diagram: Attributes, methods, associations (Primary).
    • Object Diagram: Instance snapshots.
  • Dynamic: Sequence, Communication, State, Activity, Interaction Overview.

๐Ÿ”น Summary & Audience

  • Summary: Points out major tasks and static relationships.
  • Primary Stakeholders:
    • End-Users
    • Analysts
    • Designers

3.3.3 The Development (Module) View

๐Ÿ”น Definition & Origin

  • Derivation: Derived from the Logical View.
  • Focus: Static organization of system modules.
  • Building Blocks: Namespaces, Class Libraries, Subsystems, Packages.

๐Ÿ”น Purpose & Audience

  • Mapping: Maps software components to physical directories and files.
  • Organization: Addresses subsystem decomposition and accessibility scopes.
  • Stakeholders: Programmers, Software Project Managers.

๐Ÿ–ผ๏ธ Development View Example

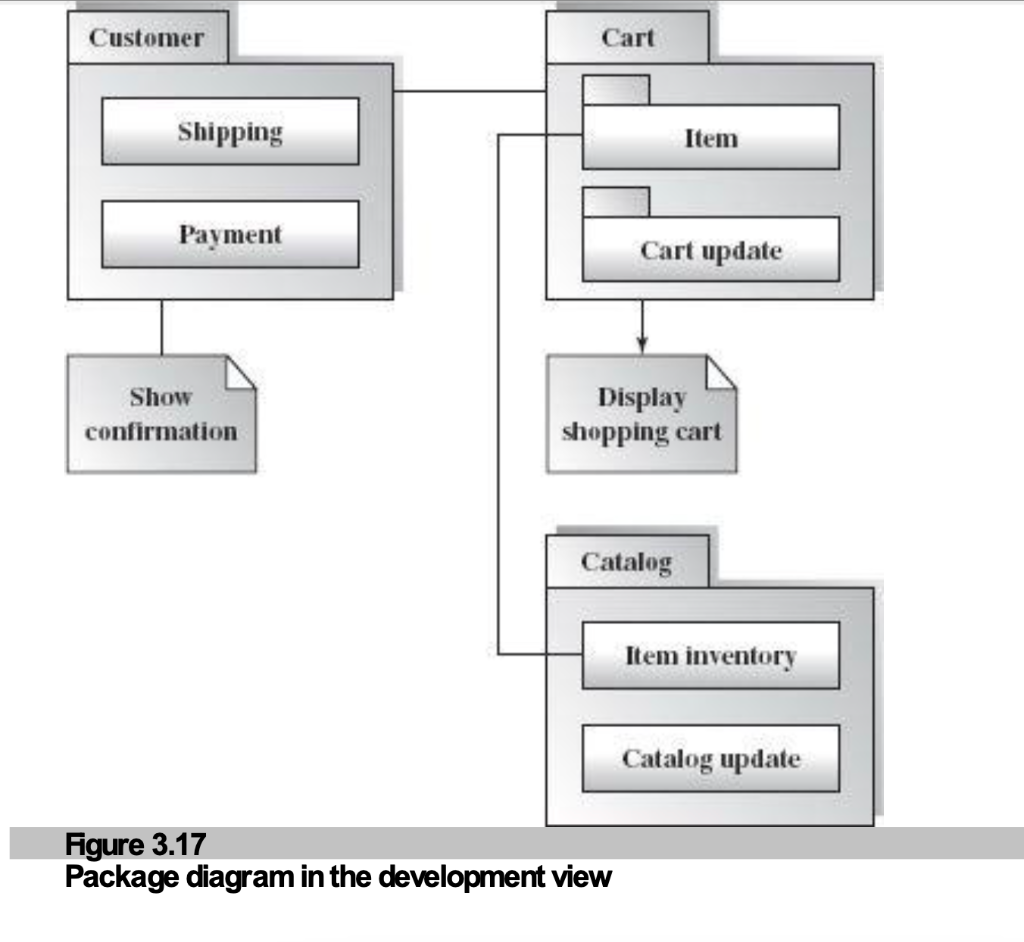
Figure 3.17: Package Diagram

Figure 3.17: Package Organization

๐Ÿ“Š Analysis of Figure 3.17

Demonstrates a modular architecture using packages:

1. Customer Package
  • Contains Shipping and Payment subsystems.
2. Cart Package
  • Core logic: Item management and Cart update functions.
3. Catalog Package

Manages Item inventory and Catalog updates.
3.3.4 The Process View

๐Ÿ”น Dynamic Aspects

  • Focus: Execution time behavior, concurrency, and synchronization.
  • Abstraction: Processes vs. Threads.
  • Quality Attributes: Performance, Scalability, Availability, Throughput.

๐Ÿ”น Communications

  • Structure: Maps functions/interactions to runtime execution units.
  • Levels: From independent networks to tasks within a node.
  • Styles: Pipe & Filter, Multi-tier, etc.
  • Stakeholders: Developers, Integrators.

๐Ÿ–ผ๏ธ Process View Example

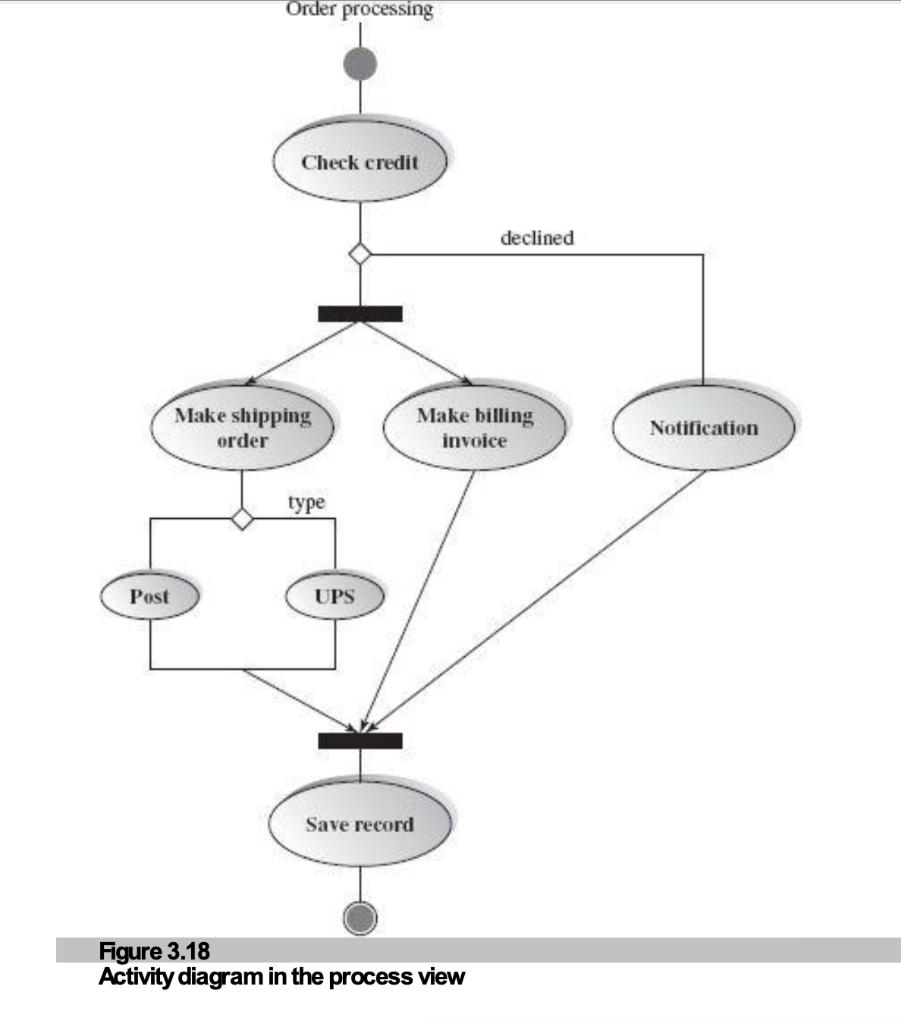
Figure 3.18: Activity Diagram in Process View

Figure 3.18: Order Processing Concurrency

๐Ÿ“Š Analysis of Figure 3.18

Illustrates runtime concurrency in order processing:

1. Sequential Start

Order Processing โž Check Credit: Standard sequential flow.

2. Parallel Execution (Fork)
  • Branch 1: Make Shipping Order (selecting Post/UPS).
  • Branch 2: Make Billing Invoice.
  • These occur simultaneously to improve throughput.
3. Synchronization (Join)

Processes wait at the join bar before Save Record executes.
3.3.5 The Physical View

๐Ÿ”น Purpose & Scope

  • Focus: Installation, configuration, and deployment of software.
  • Mapping: Maps software elements to hardware nodes (Processors).
  • Context: Critical for distributed and parallel systems.

๐Ÿ”น Quality Attributes

  • NFRs: Availability, Reliability (Fault-tolerance), Performance, Scalability, Security.
  • Topology: Defines network layouts and communication protocols.
  • Stakeholders: System Admins, Engineers, Installers.

๐Ÿ–ผ๏ธ Physical View Example

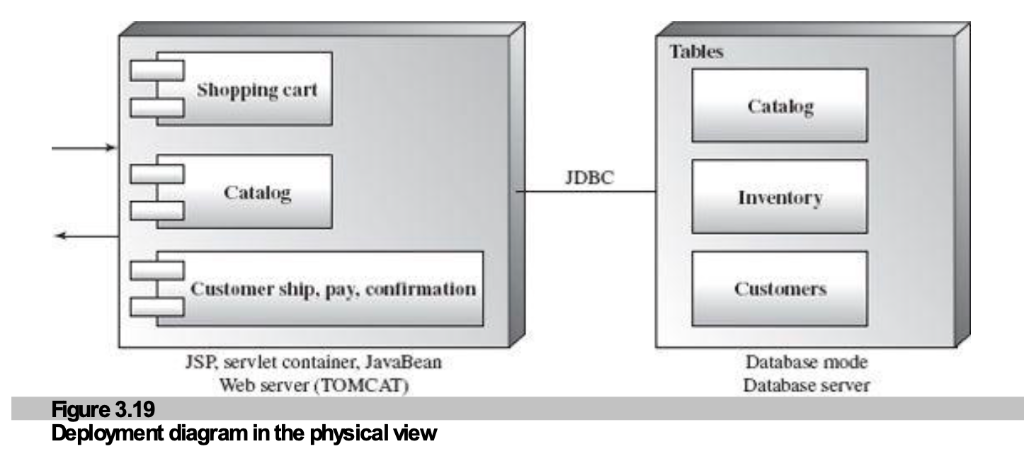
Figure 3.19: Deployment Diagram

Figure 3.19: Order System Deployment

๐Ÿ“Š Analysis of Figure 3.19

Shows the system deployment across two specific server nodes:

1. Web Server Node (TOMCAT)
  • Hosts: Shopping Cart, Catalog, Customer components.
  • Environment: JSP, Servlet container, JavaBean.
2. Database Server Node
  • Hosts: Catalog, Inventory, Customer tables.
  • Role: Data persistence and management.
3. Connection (JDBC)

The communication protocol linking the Web Server to the Database Server.
3.3.6 The User Interface View

๐Ÿ”น Definition & Scope

  • Extended View: Adds a clear User-Computer Interface perspective.
  • Abstraction: Hides underlying implementation details.
  • Impact: Direct connection to the Scenario View.

๐Ÿ”น Format & Usage

  • Presentation: Screen snapshots ("Mockups") or Dynamic Interactive Prototypes.
  • Purpose: Validates user requirements and usability.
  • Integration: Established alongside logical/process/physical views based on scenarios.

๐Ÿ–ผ๏ธ User Interface View Example

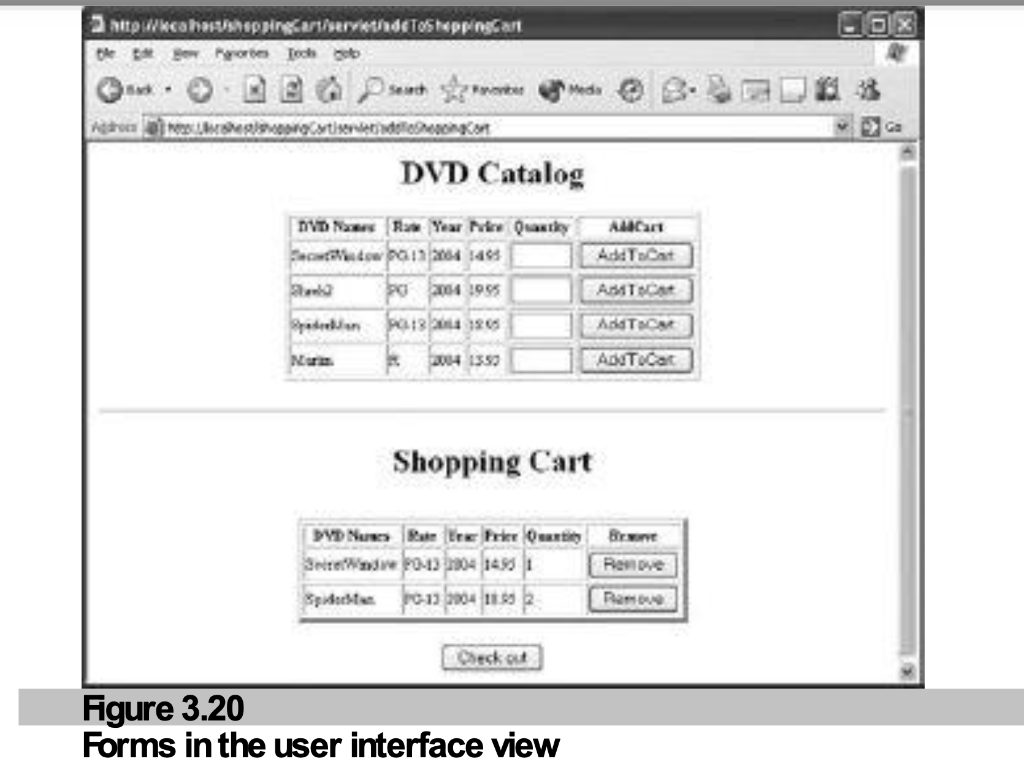
Figure 3.20: UI View Forms

Figure 3.20: Online Shopping Interface

๐Ÿ“Š Analysis of Figure 3.20

Demonstrates the End-User Experience:

1. Catalog Interface

Displays inventory (DVDs) with "Add to Cart" functionality.

2. Shopping Cart Interface

Shows selected items, quantities, and "Check out" option.

3. Verification

Validates that the Scenario (Shopping) is intuitively supported by the system.
3.4 Architecture Description Language (ADL)

๐Ÿ”น Definition & Purpose

  • Formal Notation: Syntax and semantics for defining software architecture.
  • Capabilities: Decompose/combine components, define interfaces & configurations.
  • Note: UML provides artifacts but is not a complete ADL.

๐Ÿ”น Requirements (Garlan & Shaw)

  • Composition: System from independent components.
  • Abstraction: Roles/interactions without implementation details.
  • Reuse: Component/connection level reuse.
  • Configuration: Understand/modify structure easily.
  • Heterogeneity: Combine different descriptions.
  • Analysis: Throughput, deadlock, scheduling.

ADL Examples & Acme Overview

๐Ÿ”น Common ADLs

  • Academic: UniCon, Wright (CMU), C2sadel (UCI/USC), Rapide (Stanford), Darwin (Imperial), Acme.

๐Ÿ”น Acme Elements

  • Core: Components, Connectors, Systems.
  • Interfaces: Ports (Components), Roles (Connectors).

๐Ÿ”น Acme vs. Box-and-Line

  • Formalism: Acme adds specific purpose and strict interfaces.
  • Ports: Identify contact points (Interfaces).
  • Roles: Identify interaction participants (e.g., caller/callee, sender/receiver).

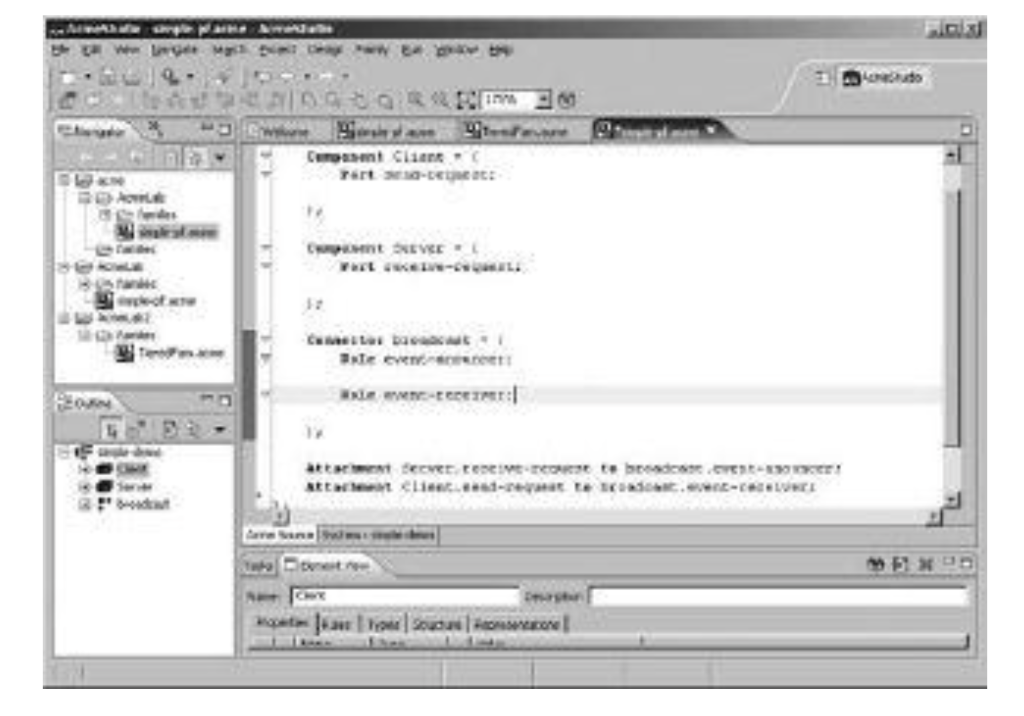
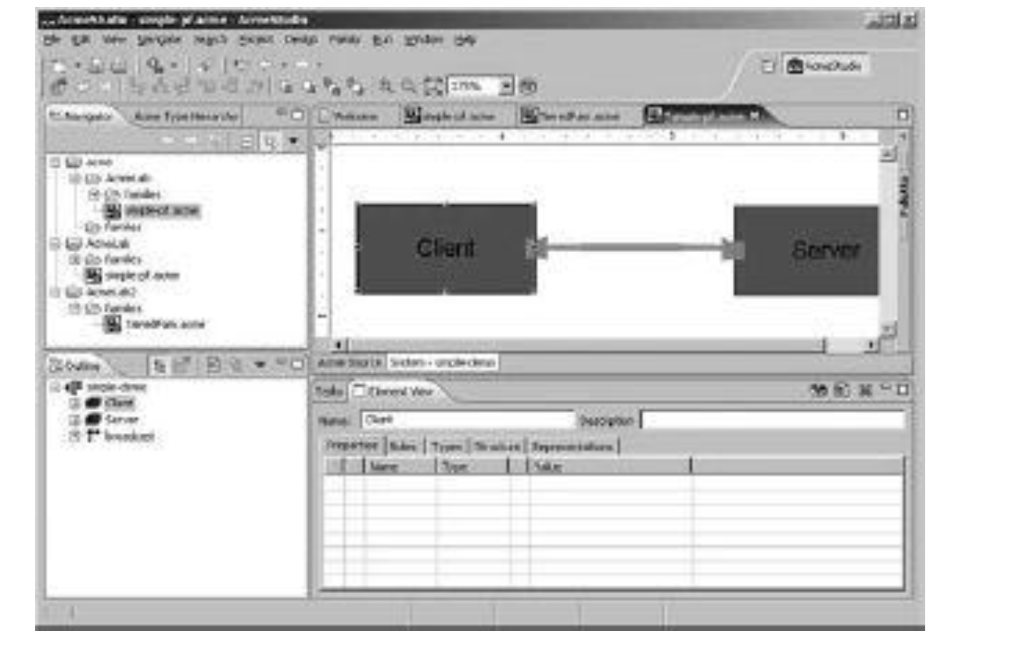
๐Ÿ–ผ๏ธ AcmeStudio: Client-Server Example

Design View

Acme Client-Server Design

Simple Client-Server Design

Code Generation

Acme Client-Server Code

Generated Acme Specification

Insight: AcmeStudio allows visual design which translates to Acme language specifications and can generate C++/Java code.
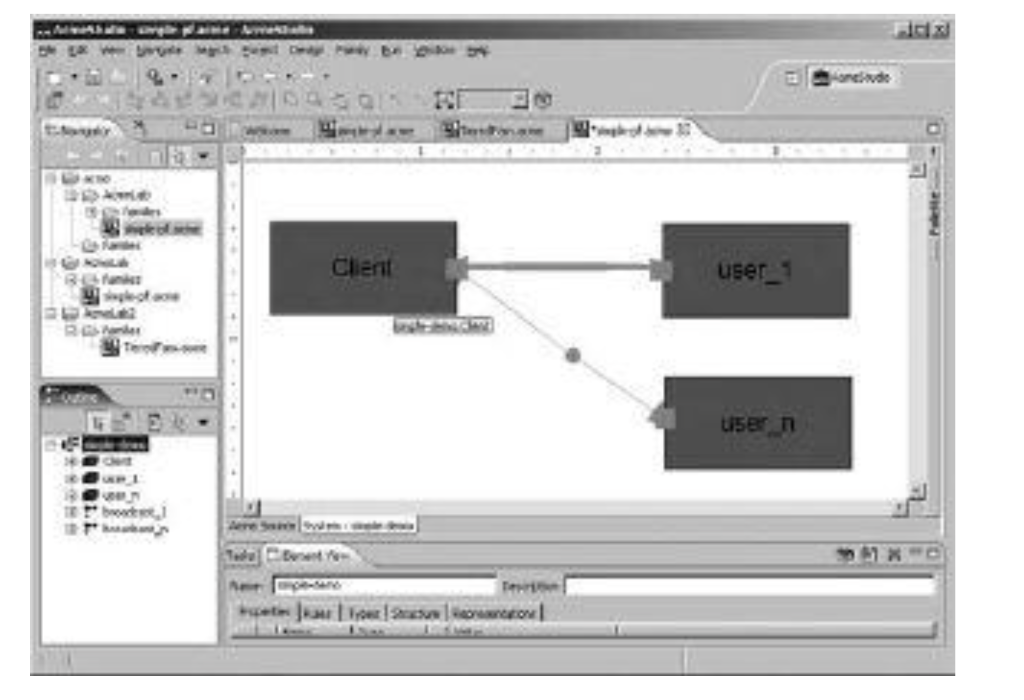
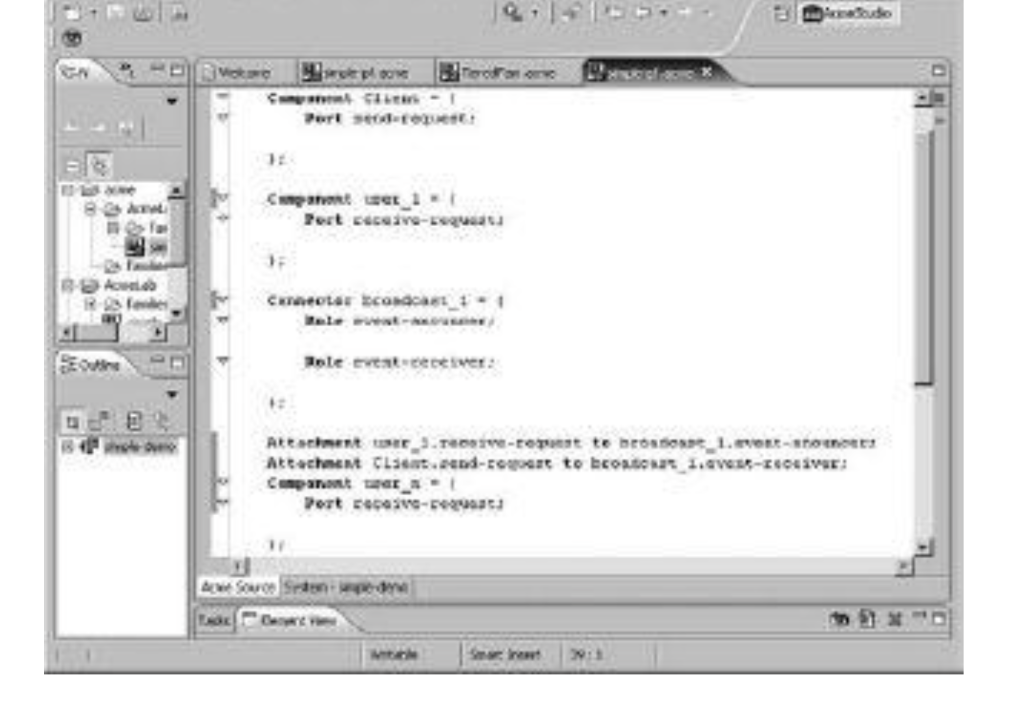
๐Ÿ–ผ๏ธ AcmeStudio: Multi-User Example

Design View

Acme Multi-User Design

Multi-User / Single Server

Code Generation

Acme Multi-User Code

Complex Connector Roles

Feature: Connectors can handle multiple roles (e.g., one event-announcer to multiple event-receivers).

๐Ÿ“ Chapter Summary: Architecture Models

๐Ÿ”น Core Principles

  • Decomposition: Most important step to reduce complexity and optimize guidelines (low coupling/high cohesion).
  • Trade-offs: Multiple views facilitate balancing quality attributes (e.g., Performance vs. Maintainability).

๐Ÿ”น Modeling Recap

  • UML: Standard for specifying complex systems (Structural & Behavioral).
  • 4+1 View Model: Comprehensive blueprint (Scenario, Logical, Development, Process, Physical, UI).
  • ADL: Formal notation for rigorous architecture description and code generation.

Conclusion: Architecture design satisfies both functional and non-functional requirements through multi-view modeling.

๐Ÿ“š References

  • Garlan, David and Mary Shaw.
    Software Architecture: Perspectives on an Emerging Discipline.
    Upper Saddle River, NJ: Prentice Hall, 1996, 39-40.
  • Kruchten, Philippe.
    "Architectural Blueprintโ€”The '4+1' View Model of Software Architecture."
    IEEE Software, vol. 12, no. 6. (1995): 42-50.

๐Ÿง  Review & Exercises

๐Ÿ”น Self-Review Questions

  • Which view does the Sequence Diagram support? (Logical)
  • Which view addresses concurrency control? (Process)
  • Is ADL a programming language? (No, but can generate code)
  • Does the 4+1 model work only with OO? (No)

๐Ÿ”น Challenge Exercises

  • 1. Online Trusted Payment System: Model users (Buyer, Seller, Trustee) and flows.
  • 2. Hotel/Motel Reservation System: Model room selection, billing, and reservations using 4+1 views.
  • Goal: Apply UML and 4+1 views to describe these complex architectures.